what it is
A TERRITORIAL INTELLIGENCE PLATFORM FOR STRATEGIC MONITORING
The environmental strategy monitoring viewer is a platform that links a territory’s strategic goals to the places where their fulfilment is decided. It combines official indicators, 3D mapping and simulation to guide public action and assess progress.
objectives
MONITOR, LOCATE AND ANTICIPATE
The viewer makes it possible to measure the distance to targets, pinpoint the areas where the remaining effort is concentrated and compare alternative courses of action before investing. It thus provides a shared basis for coordinating an organisation’s different departments and monitoring its transformation commitments.
features
DASHBOARD, MULTI-SCALE ANALYSIS AND AUTOMATED UPDATES
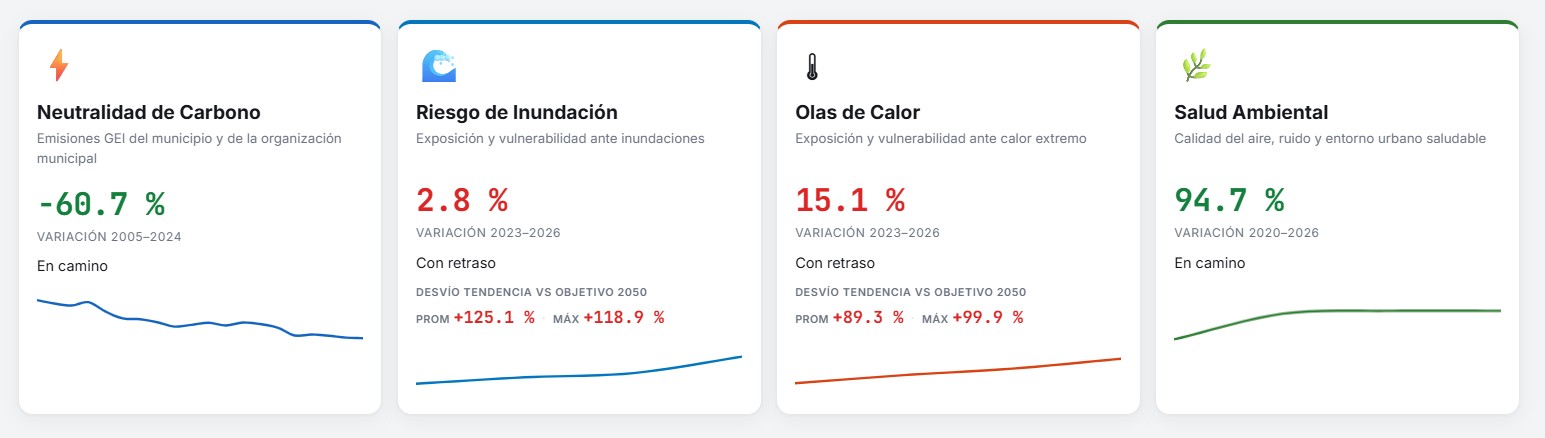
- A dashboard organised by strategic pillars, showing how indicators are evolving, the progress made and the deviation from targets.
- Multi-scale analysis: queries can be run by municipality, neighbourhood, street, park, square, building or areas drawn on the map, with results aggregated to the selected scale.
- Connection to official sources through automated ingestion and update processes, aligned with the availability and frequency of each source.
- Three levels of reading: observed data describing the starting point, models that help to interpret phenomena, and simulations for exploring possible interventions.
beneficiaries
CITY COUNCILS, PROVINCIAL COUNCILS AND PUBLIC AGENCIES
City councils, Provincial Councils and public agencies that need place-based monitoring of their environmental, climate or urban transformation strategies.
Each implementation starts by identifying the organisation’s strategic goals, management questions and relevant scales. The modules, sources and scenarios are then defined according to the data available, their publication schedules and their territorial resolution.
possibilities
ANALYSIS AND SIMULATION MODULES
The viewer is organised into modules that can be combined to suit the needs of each territory:
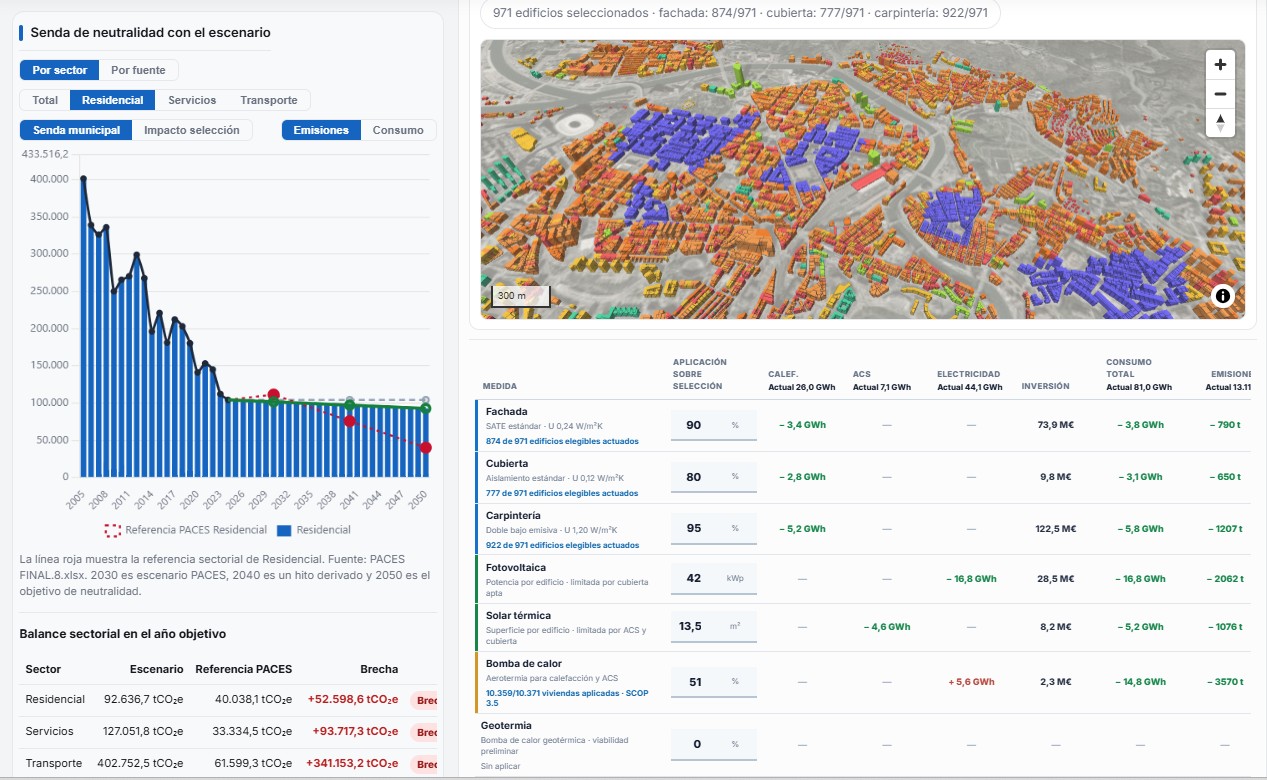
1. Decarbonisation: emissions trajectories by sector and energy source, and simulation of retrofit, solar PV or heat pump measures on a selection of buildings, with their estimated effect on consumption, emissions and investment.
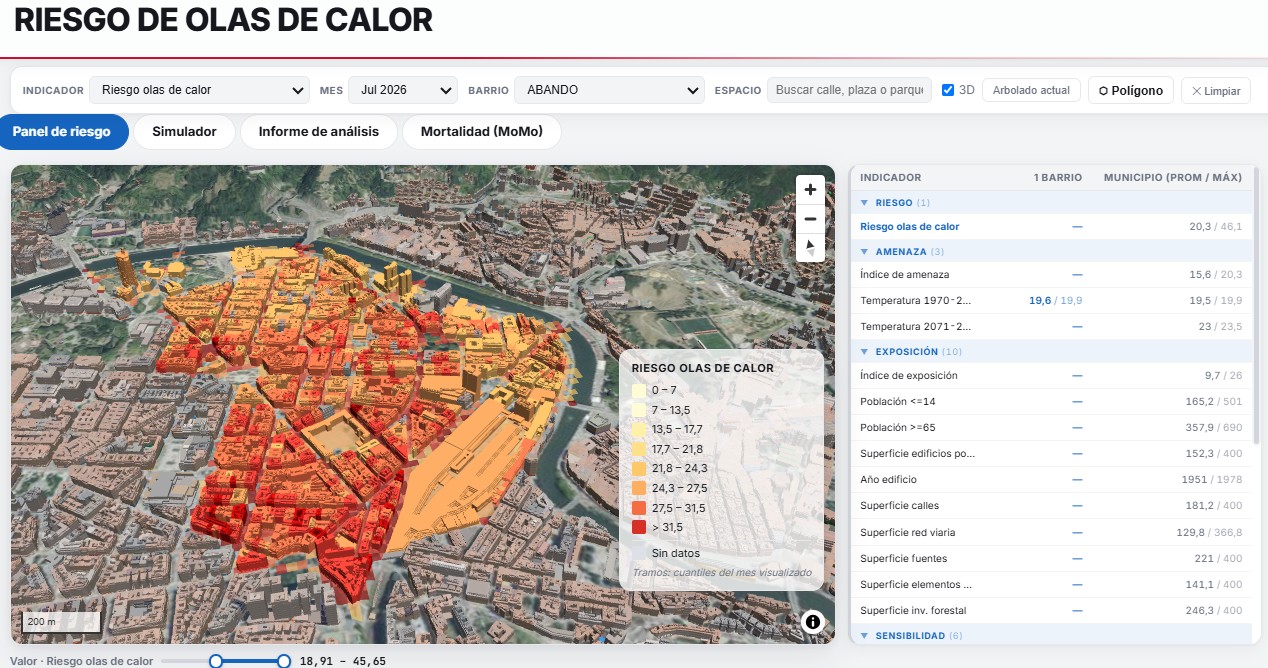
2. Climate adaptation: assessment of flood and heatwave risk based on hazard, exposure, sensitivity and adaptive capacity, with simulation of responses such as green spaces, tree planting or climate shelters.
3. Green infrastructure and renaturalisation: a geolocated inventory of trees and green spaces, vegetation index and sun exposure, and the design of renaturalisation proposals with estimates of their environmental benefits.
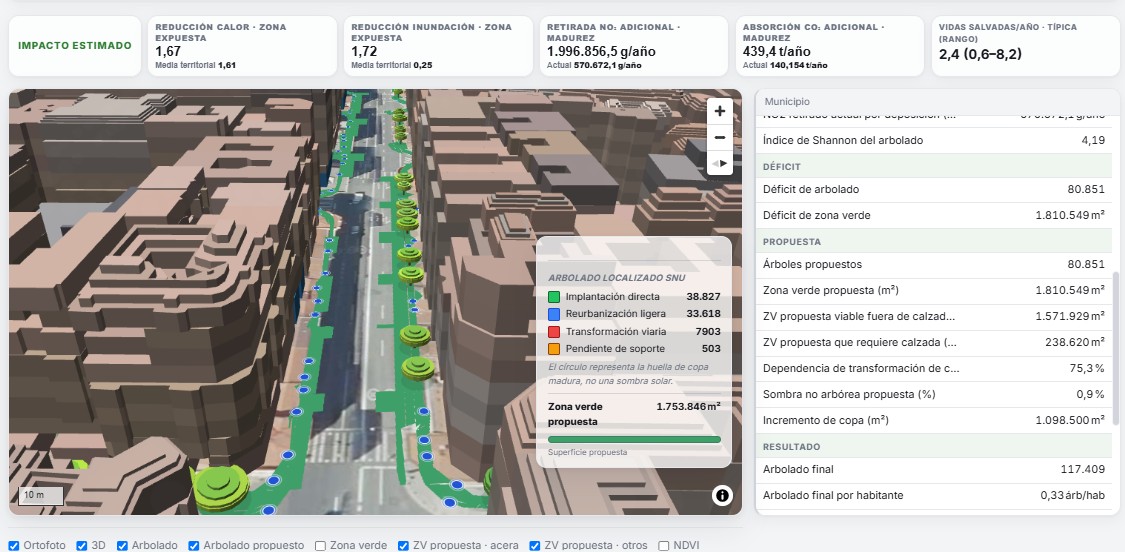
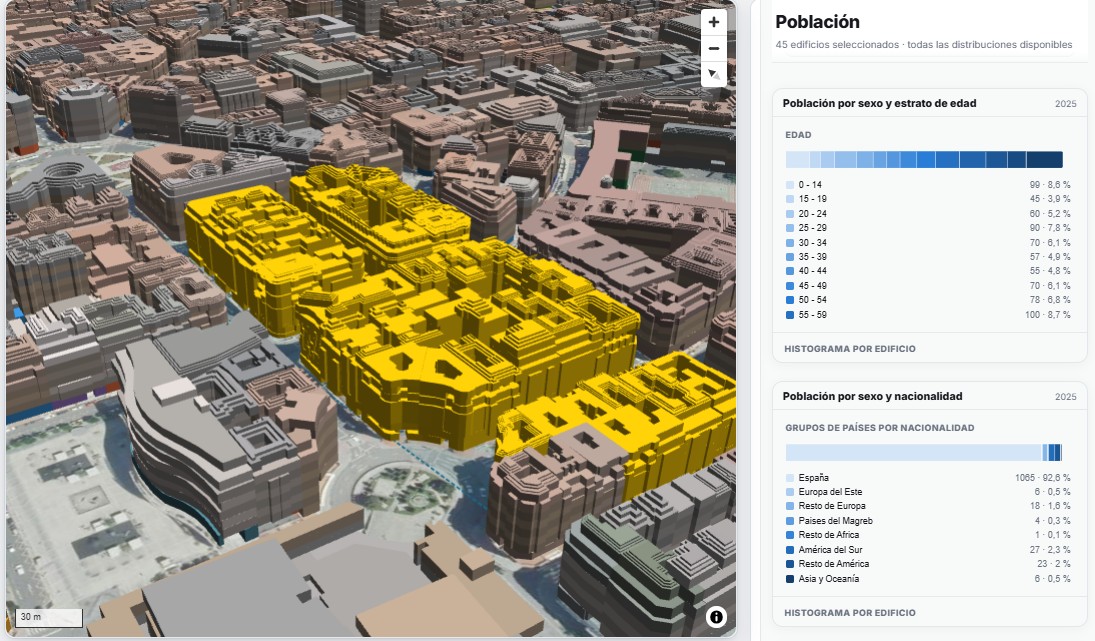
4. Population, housing and economic activity: profiling of custom-defined areas based on population, housing stock and businesses, without being limited to administrative boundaries.
5. Accessibility and proximity: analysis of walking reach from a point in public space, taking into account the effect of slope and the services accessible by category.
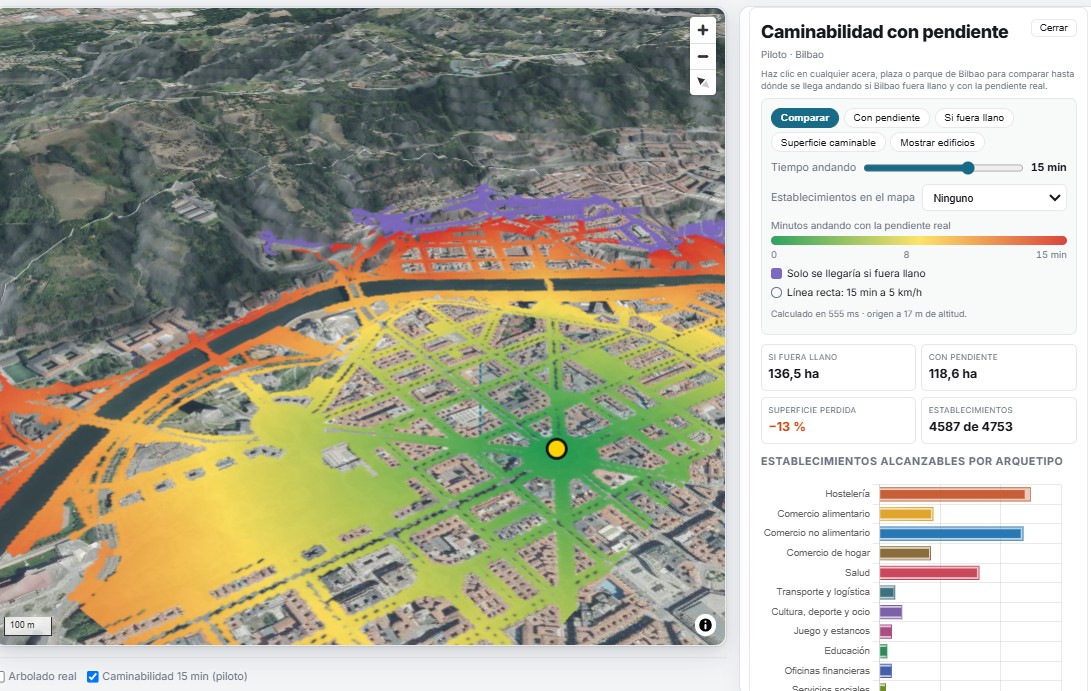
Values shown in the screenshots come from a demonstration environment. The accessibility and proximity module is at pilot stage.
interaction
IMPLEMENTATION IN BILBAO
The viewer has been implemented to monitor the Bilbao 2050 Environmental Strategy, with a dashboard covering its four pillars: carbon neutrality, flood risk, heatwaves and environmental health.